

COV CATNAP Help
- We greatfully acknowledge the Oxford University CoV-AbDab, described by Raybould et al. 2021, as the source of most of the antibody sequence and germline data that we include.
- The statistical analysis follows Gnanakaran et al. 2010.
- The tool interface and database are based on HIV CATNAP, designed by Hyejin Yoon, Jennifer Macke, Bette Korber, and Karina Yusim.
- When using this tool in a publication, please cite:
-
Yoon, H., Macke, J.P., Montefiori, D., Shen, X., and Korber, B. CATNAP Antibody and Sequence Relationships for SARS-CoV-2. Manuscript in preparation.
-
Yoon et al. CATNAP: a tool to compile, analyze and tally neutralizing antibody panels. Nucleic Acid Res 2015 Jul 1;43(W1):W213-9. PMID 26044712.
-
- We accept SARS-CoV-2 antibody neutralization data submitted directly by authors.
- We welcome suggestions of published neutralization data for addition to CATNAP.
- Please contact us for details.
This interface combines:
- Neutralization data,
- Virus information,
- Antibody information,
- Analysis tools.
The interface can serve simply as a way to obtain neutralization and antibody data for download. We also provide analysis tools to help you analyze the data in various ways.
Neutralization data are taken from publicly-available scientific papers and data repositories. In some cases, these data are in preprint status. In some cases, authors are asked to provide numerical data when their paper contains only non-numerical neutralization data, or to provide clarification on ambiguities. If you have a question about the source of any data, please contact us.
Viral sequence data are taken from GenBank nucleotide or protein databases. Sequences not available in GenBank are constructed based on published mutation lists.
We greatfully acknowledge the Oxford University CoV-AbDab, described by Raybould et al. 2021, as the source of most of the antibody structure links, antibody sequences, and germline data that we include. In accordance with the terms of their open source license, we include the full list of original publications that their data were derived from (in the field named "Germline / structure / sequence sources"). See description of antibody fields below in Antibody details.
CATNAP has been tested in Chrome, Firefox, and Safari. Some functionality may be incomplete in other browsers.
In order to make CATNAP, we choose a well-known name for each antibody and virus. We try to keep track of the alternative names used in the literature, and record these alternative names as aliases. When you download antibody or virus information from CATNAP, we include the list of known aliases.
The input page allows you to retrieve details about selected Spike sequences and antibodies used in neutralization panels, and to analyze IC50, IC80, and ID50 data.
Select by...
- Antibody and Virus This tab shows all antibodies and viruses available. If you select fewer than 10 antibodies, you can check the box at the top to include ALL viruses. Likewise, if you select fewer than 10 viruses, you can check the box at the top to select ALL antibodies.
- Study allows you to select all the data from specific study(s).
- Antibody, Virus and Study allows you to select combinations of antibodies and viruses, and further limit the search to specific studies.
Select Antibodies by...
- Names allows you to select from an alphabetical list. You can click the column headings to sort by binding type or number of viruses tested. Antibody mixtures and polyclonal antibodies are listed in separate sections at the bottom.
- Attributes allows you to select antibodes based on their characteristics, as defined below in Antibody details.
- Your list allows you to paste or upload your own list of favorite antibodies. The names of the antibodies must match exactly the names used in CATNAP.
Select Viruses by...
- Names allows you to select from an alphabetical list. You can click the column headings to sort by subtype or number of antibodies tested.
- Attributes allows you to select viruses based on their species, etc. Definitions are given below in Virus details.
- Your list allows you to paste or upload your own list of viruses. The names of the viruses must match exactly the names used in CATNAP.
Retrieve: Antibody details
Select antibodies of interest and retrieve:
- Ab name
The name we use. Note that some antibodies have multiple names in the literature. - Isolation paper
The reference that first described the isolation of the antibody. - Species
The host species from which the antibody was derived. - Ab type
- monoclonal: these are monoclonal antibodies derived directly from a human or non-human subject.
- monoclonal engineered: these are monoclonal antibodies that have been mutated or otherwise engineered.
- polyclonal: sera samples tested for neutralization.
- Fab or nanobody: antibody fragments that have been tested for neutralization.
- non-antibodies: these are other molecules with the potential to neutralized the virus.
- Binding type
The binding type is defined by the region of Spike that the antibody binds. The class is given as defined by the author, as originally described by Barnes et al. 2020 PMID 33045718. - Epitope group
Epitope classes are reported as given by the author, and defined by Cao et al. 2022 PMID 35016194. - Immunogen
Whatever elicited the antibody, typically a vaccine, a viral infection, or both. - Vaccine type
The type of vaccine involved when the immunogen was a vaccine. For human antibodies, this may be the clinical name of the vaccine, such as - Vaccine strain
The strain of the virus involved when the immunogen was a vaccine. When "WT" is shown, this indicates that the vaccine strain was pre-Omicron, but the specific type isn't known. - Infecting strain
When the immunogen was an infection, this is the strain of the virus that was involved. If the patient was infected more than once, this would be the most recent infecting strain. - Days post-onset of symptoms
When the immunogen was an infection, this field indicates the number of days from the onset of symptoms to the time that the sample was taken. - Ab Patient
The code for the patient or animal from which the antibody was derived. When the isolation paper did not assign a code, we may assign one in order to indicate multiple antibodies that were derived from the same patient or animal. - Note
Other pertinent information about the antibody, entered by LANL CoV Pipeline staff. - Alias
Other names for this antibody encountered in the literature. - Clinical name
The trade name of any antibody developed for clinical use. - Clonal lineage
A name given to link antibodies of clonal origin. In some cases these names link a natural antibody and its engineered variants. - Neutralizing antibody feature
Links to Spike contacts and amino acids associated with binding or neutralization. These links go to results in our Spike Features database. - # assays
The number of assay data points for this Ab in this database. - CATNAP ID
The number of assay data points for this Ab in this database.
Expanded antibody details
After clicking the Expand button, additional antibody details are displayed:
- Structure
Links to PDB structures for this antibody. Most data in this field are imported from CoV-AbDab. - Heavy/Light V and J genes
- Heavy/Light CDRH3 seq
- Germline, structure, and sequence sources
These links represent the original sources for data in the fields pertaining to structures, germline genes, and antibody sequences. In most cases, these sources are shown as given by CoV-AbDab. - Light chain type
Kappa or lambda, represented as K or L. Most data in this field are imported from CoV-AbDab. - Heavy/Light chain sequence
- Most data in this field are imported from CoV-AbDab.
- Some data are entered by LANL staff, and linked to the source.
Retrieve: Virus details
Select viruses of interest and retrieve:
- Virus name
The name we use in our database to correspond with a specific Spike sequence. We make every effort to confirm the exact strain and sequence that authors used in the published neutralization assay. In some cases, variants of baseline versions are named "_alt" when they carry sequence variations that are unlikely to profoundly affect neutralization. - Organism
CoV-1, CoV-2, or other CoV sarbecovirus - VOI/VOC/VUM
Yes indicates that the virus is (or has been) a variant of interest or variant of concern. - GenBank accession
- Aliases
Other names used for this virus in various studies. - LANL comments
Retrieve: Assay
Choose any antibodies and/or viruses and retrieve a downloadable table of available IC50 or other data. When multiple studies assayed the same antibody-virus combination, the geometric mean of the data points is shown (calculated as described below).
Analyze: Assay along with virus sequences
Choose any antibodies, viruses, or study of interest and view neutralization data, displayed together with viral Spike sequences. The resulting Analysis Page is described below.
You can further limit the results of your search using selector boxes.
- Select assay method(s)
Use the menu to include/exclude any assay types. If no selection is made, all assay types will be included, and data from multiple assay types will be included in geometric means. - Include tests beyond threshold of detection in geometric mean estimates
Geometric means are calculated only from numerical values within thereshold. Check this box if you want to calculate means using entire data set both within and beyond a threshold. See below Geometric Means for more details. - Exclude viruses having no sequence data
Check this box if you want to limit your analysis to viruses with a Spike sequence available. - Include only SARS-CoV-2
Check this box if you want to limit your analysis to CoV-2. - Include only VOI/VOC/VUM
Check this box if you want to limit your analysis to viruses that are (or have been) variants of interest/concern. - Show resistance relative to D614G
Check this box to show a calculation of IC values relative to D614G virus; see below for Relative Resistance Calculation. - Email results
Check this box if you have problems with browser timeouts or a slow internet connection.
The analysis page appears after you choose the "Analyze along with virus sequences" option. Lots of information and further analyses are available.
Analysis page shows 3 aligned windows side-by-side:
- Left window: virus names
- Lists the virus names included in the analysis.
- You can widen the panel to show attributes of the viruses.
- Center window: Ab(s) with their IC or ID neutralization data.
- An asterisk (*) at the top indicates that some data are geometric means (calculated as described below) based on multiple studies.
- Clicking the Ab name will sort the column by neutralization score (grouping together the neutralized and non-neutralized viruses).
- When multiple studies assayed the same antibody-virus combination, the geometric mean of the data points is shown (calculated as described below).
- The "Expand to individual vals" link expands all the data to show the data points from multiple studies used to calculate the geometric means.
- A mouseover on each individual mean will also show the data points used to calculate the geometric mean, together with the study references.
- Download link (below the window) provides neutralization data together with virus details.
- Right window: sequences of the viruses.
- Amino acid sequences are aligned and shown together with the Wuhan-Hu-1 reference sequence (GenBank NC_045512).
- Download link provides the amino acid alignment shown.
Additional information provided under the 3 aligned windows above:
- Potency and breadth of each antibody over the selected group of viruses:
- Potency:
The geometric mean of the neutralization values of the individual viruses shown is calculated 2 ways:
- The geometric mean of detected viruses indicates how well the antibody neutralizes those viruses that is does neutralize below the experimental cutoff (values such as >25, >50, >100 μg/ml are excluded).
- The geometric mean of all viruses, where neutralization values above cutoff (such as >25, >50, >100 μg/ml) are set to 100 μg/ml.
- Breadth: The percentage of assayed viruses neutralized within the experimental cutoff.
- Potency:
The geometric mean of the neutralization values of the individual viruses shown is calculated 2 ways:
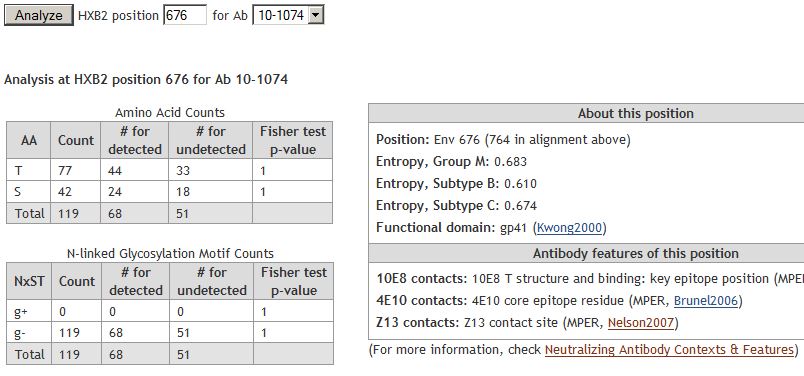
- Position Analysis
Analyze any sequence position and examine the correlation of mutations with neutralization of the chosen antibody. Pick an antibody and enter the Spike position in the provided space. You will see information about this specific amino acid of Spike:- Highlighting of this position on the alignment with a grey vertical line.
- Amino acid makeup of that position in the alignment (count of amino acids at the position) and the count of viruses with and without predicted N-linked glycosylation motif (denoted as NxST) (calculated as described below).
- Count of detected and undetected viruses with this antibody for each amino acid found in this position of the alignment. The Fisher's exact test is based on a contingency table of 'AA/not AA' and 'virus detected/not detected'.
- Odds ratio. An odds ratio >1 indicates that the amino acid is enriched among detected viruses. An odds ratio <1 indicates that the amino acid is enriched among undetected viruses.
- Count of detected and undetected viruses with this antibody when an N-linked glycosylation motif is present (g+) or absent (g-) for this position of the alignment. The Fisher's exact test is based on a contingency table of 'NxST/not NxST' and 'virus detected/not detected'.
When more than one study assayed the same antibody-virus combination, we present a geometric mean value. A geometric mean indicates the central tendency of a group of n numbers. It is calculated as the nth root of the product of n values. We basically compute means using reported numerical data but when values were reported as a < or > number, we treat them as follows:
- Within threshold: when a value was given as <x (IC50/80) or >x (ID50/80), then the mean was calculated using x.
- Beyond threshold: when a value was given as >x (IC50/80) or <x (ID50/80), it is excluded from the calculation, unless the "Include tests beyond threshold of detection in geometric mean estimates" option is checked. If you check the option, the mean is calculated using 100 (IC50/80) or 20 (ID50/80).
Issues Impacting on Geometric Means
The data gathered for the CATNAP tool includes neutralizing antibody data assembled from the scientific literature, as well as sequences from pseudotyped viruses used in neutralizing antibody assays. Inhibitory concentrations IC50 and IC80 (lower values more potent neutralization) are provided for antibodies and their combinations, and inhibitory dilutions ID50 and ID80 (higher values more potent neutralization) for plasma/sera.
CATNAP then provides a geometric mean value for every antibody/Spike pair as a summary value, averaged over all studies that report this combination. Users are able to save CATNAP output, and can download a text file containing all of the independent values and the references that were incorporated into a given geometric mean, and thus get a feel for the content of baseline data.
There are a some important issues to keep in mind as you use these data summaries.
- Naturally there is experimental variability between labs and assays, and so the use of a geometric mean is intended to represent an approximate "typical" behavior.
- COV CATNAP includes data derived many different types of neutralization assays, including both pseudovirus and live virus assays. We provide the option to limit your results to specific assay types.
- If an antibody neutralization curve plateaus very near an IC50 or IC80 cutoff, sometimes it will be just over the cutoff and considered beyond the threshold of a detectable score, while other times it will be just below it. For example, the highest amount of an antibody tested might be 50 ug/ml, and if the IC80 is near 50 ug/ml, sometimes it will be classified as “undetected.” However, if repeated, it may have a detected value just below 50. Depending on the availability of an antibody, and the importance of an experiment, different maximum concentrations can be used for the same antibody in different studies (20, 50, 100, etc.). When we calculate our geometric mean estimate, the default is to exclude values that were beyond the threshold of detection, if any of the repeated experiments were positive. But we also provide an option to calculate geometric mean estimates including tests that were above the threshold, setting a score of “100” for the purpose of the estimation.
- Studies often integrate previously-published data sets into their new analysis, and published data tables can include combinations of old and new data. When data points are repeated in the literature, they may be repeated in CATNAP too, as the tool reflects that literature. As a result, not all of the data points that go into the geometric mean calculations are independent, and some data will be over-weighted due to reuse in the literature. Users can, if desired, review the downloaded CATNAP data, pick a subset of papers to minimize this bias, and rerun CATNAP on just those selected papers.
Trim and Re-calculate geometric means
Instead of using the full set of data in CATNAP collection, you can select data from specified papers and calculate geometric means again on those selected ones. This could be useful to reduce data redundancy or to address inconsistencies between studies.
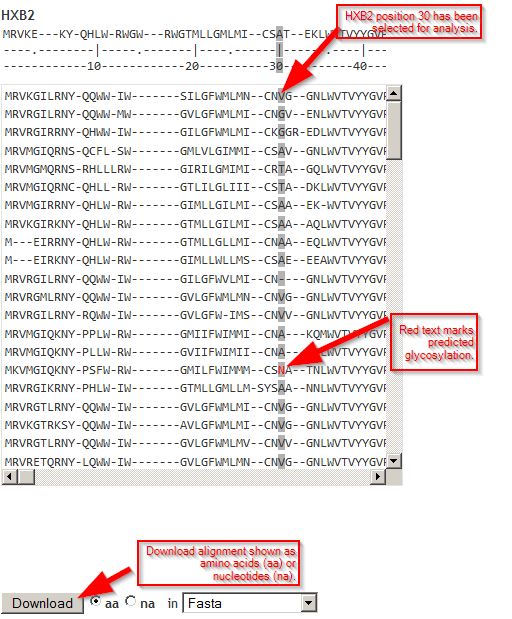
Potential N-linked glycosylation sites are highlighted when an N-X-T or N-X-S pattern occurs, where X is any amino acid except proline (P). Any gaps (-) inside the pattern are disregarded.
When you check the box "Show resistance relative to D614G" the software will provide an additional output column that calculates and displays IC/ID values relative to D614G. The relative resistance (RR) for D614G is set to "1", and the RR is calculated for the other viruses in the assay by using this formula:
Relative resistance = IC50 for virusX ÷ IC50 for D614G
Example calculation:
virus		IC50		RR
D614G		0.2		1
D614G_A67V	0.4		0.5
WT		<0.01		0.05
Omicron_BA.1	>5		25
Omicron_BA.2	UD		UD
Additional details:
- One study may contain several data tables, and these are entered individually into the database, with an assigned "dataset" name.
- Each individual RR value is calculated based on the IC/ID of D614G from its own study (and its own dataset) only.
- Each individual RR value is calculated based on the value for D614G from its own data type only. For example, IC50 and IC80 RR values are calculated separately if both are present.
- If a dataset has no assayed values for D614G, no RR values are calculated.
- If your results include more than one dataset with RR calculations for a given Ab-virus combination, the two RR values are combined into a geometric mean, indicated by an asterisk (*).
- Greater than (>) and less than (<) symbols are ignored. When the IC/ID value is <x, or >x, the RR is calculated based on x.
When viewing RR values where a geometric mean has been calculated, you can still view individual values: (1) click the link to "Expand to individual vals", or (2) mouse over any value marked with * and the mouseover will show the study, dataset, and assay type of the individual IC/ID values or individual RR values.
Note: these screenshots were made for the HIV version of CATNAP, but most features are the same for CoV CATNAP.
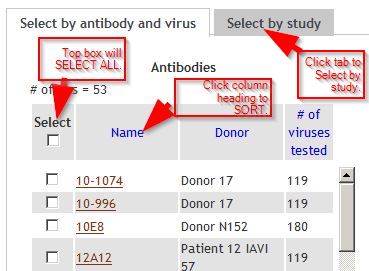
Input page tipsTo SELECT ALL, check the box at the top of the column. To SORT a column, click the column heading. To SELECT BY STUDY, click tab. |
|
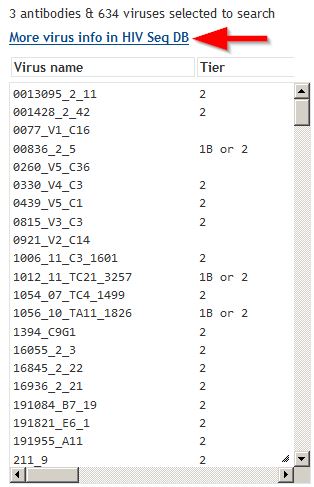
Analysis page: Virus informationThe viruses analyzed are listed. |
|
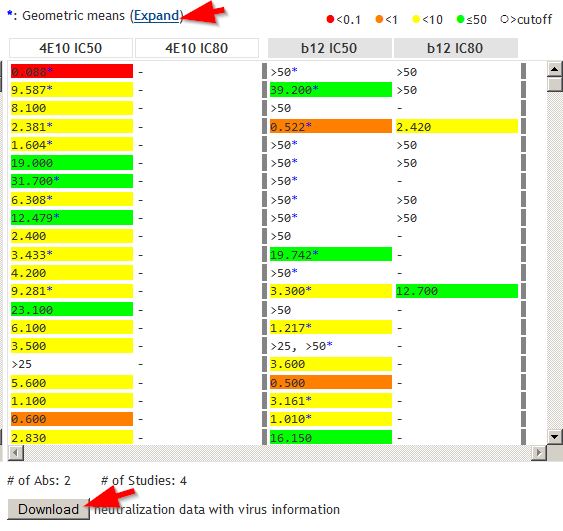
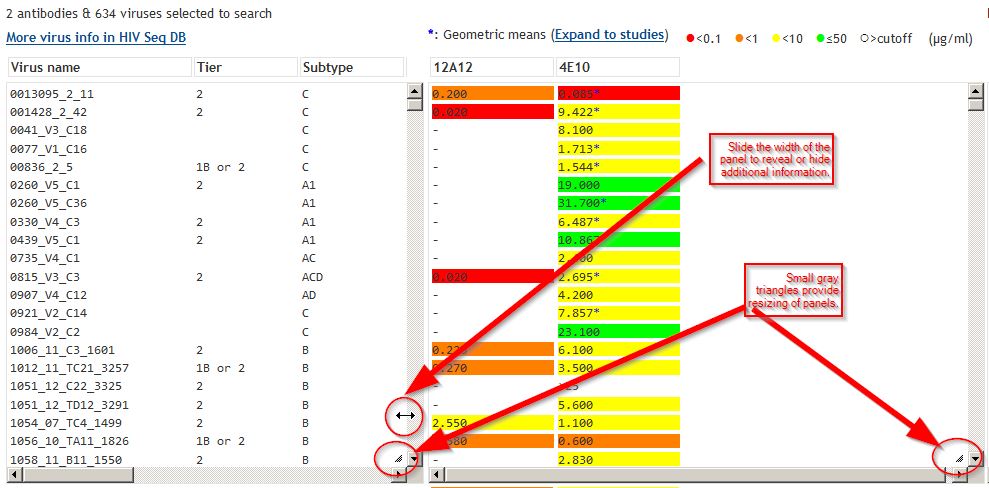
Analysis page: IC50 and IC80 dataAntibodies analyzed are shown. In the example, both IC50 and IC80 data are shown for antibodies 4E10 and b12. Results are color-coded, as indicated by the scale at upper right. Asterisks (*) indicate data that are geometric means from multiple studies. Click "Expand" to see individual data points used to calculate geomeans. Click Download button to obtain the neutralization data shown, together with virus information. |
|
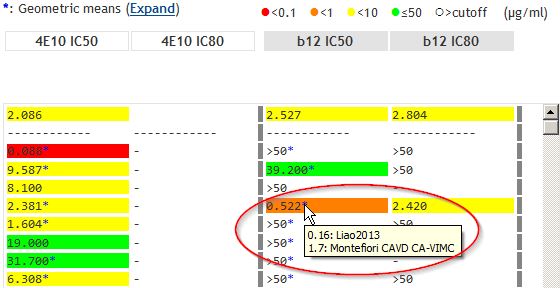
Analysis page: MouseoversMouseovers show individual data points used to calculate geomeans. References are also shown. |
|
Analysis page: alignmentAligned viral sequences are shown, with the reference sequence at the top. Numbers 10, 20, 30... are reference sequence coordinates. When a position has been selected for analysis (see screenshot below), it is highlighted in gray. Download links provide amino acid or nucleic acid alignments in Fasta or other sequence formats. |
|
Analysis page: Ab contact positionsAntibody contact positions for the antibodies analyzed are shown, if available. Click any position and it will appear in the box for "NC_045512 position". |

|
Analysis page: widen panelsYou can slide the width of panels to reveal or hide information. |
|
Analyze positionAnalyze any position in the alignment (for any one antibody) to see additional information:
|
|
Questions or comments? Contact us at seq-info@lanl.gov.